

Most MIS Reports Take a Full Day to Build. This One Takes Under Two Hours — Built Step by Step, With AI Doing the Drafting.
A monthly MIS report is one of the most repetitive, highest-value documents a CA produces — and one of the most time-consuming to build from scratch every month. Here’s the exact five-step build, with the prompts I actually use.
Every CA has built an MIS report the slow way at least once. You pull a trial balance into a blank sheet. You build the P&L by hand. You dig up last year’s numbers to compare. Then you write the commentary late at night before a morning client meeting. This guide shows a faster way — a complete MIS report in Excel using AI, built in five clear steps. These are the same steps, and the same prompts, I use for a real SME client. Not a made-up example.
By the end, you’ll have a report with four parts: a Summary Dashboard, a P&L with variance numbers, a KPI trend section, and commentary that sounds like it was written by someone who understands the business — because it was checked by someone who does.
📑 Table of Contents
- A complete MIS Report in Excel using AI can go from blank workbook to client-ready in under two hours, once the template exists.
- AI drafts structure, variance commentary, and narrative — it never decides what a number means without your review.
- Build the template once; every month after that is populate-and-verify, not rebuild-from-scratch.
- Every AI-drafted section in this guide has a matching manual-verification step — treat none of them as optional.

Step 1 — Structure the MIS Report in Excel Using AI
Most CAs build the MIS structure a little differently each month — a tab added here, a section moved there. That makes one month hard to compare with the next. A fixed structure, built once, fixes that.
Where AI entersI ask AI to suggest a tab structure based on the client’s business. Once it looks right, I lock it in as the permanent template.
Exact prompt I use
Step 2 — Consolidate the trial balance
A trial balance uses raw account names. An MIS report needs standard categories. Mapping one to the other — the same way, every month — is slow, and easy to get wrong on a long trial balance.
Where AI entersI paste just the ledger head names — no figures — and ask AI to suggest the mapping. I turn that into a lookup table in Excel.
Exact prompt I usePro tip
Save the finished mapping table as a permanent lookup in your workbook. You only need AI to build it once per client. After that, new ledger heads are rare — you just check those, not the whole list.

Step 3 — Build the P&L variance section
Once the trial balance is mapped, you need to explain what changed this month versus last month, and versus last year. This is the same variance-review work covered in the monthly close workflow — here it goes straight into the MIS pack instead of a working paper.
Where AI entersOnce the P&L figures are checked and correct, I ask AI to turn them into MIS-ready commentary.
Exact prompt I useCHECK
REQ’D
What I still check by hand
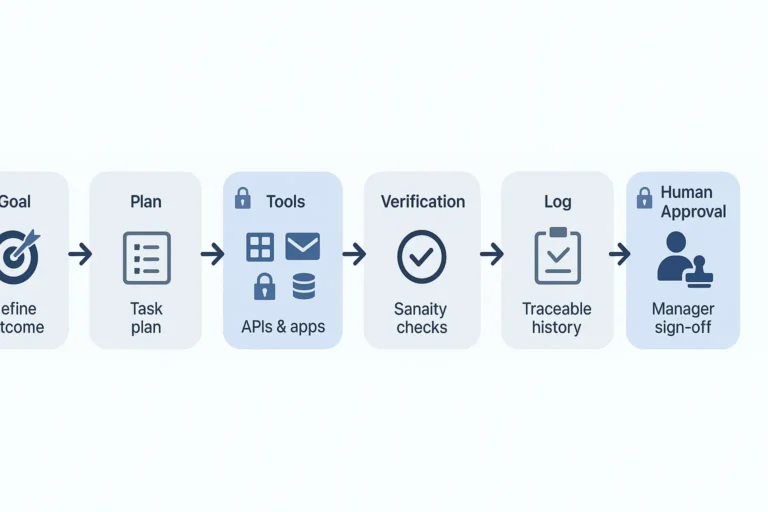
Every variance number here must already be checked before AI writes commentary about it. Never hand AI raw, unchecked numbers and ask it to explain them — it will write a smooth explanation for what might just be a coding mistake.

Step 4 — Add the KPI & ratio trend section
A rolling six-month view of the ratios that matter — gross margin, current ratio, debtor days, DSCR if the client carries debt — takes real time to calculate and format the same way every month.
Where AI entersOnce the formulas are set up, AI’s job is simple: flag which numbers have moved outside a normal range, so Step 5’s commentary focuses on the right things.
Exact prompt I use
Step 5 — Draft management commentary
The commentary on the Dashboard tab is the part a business owner actually reads first. It needs to be short, clear, and correct — no jargon.
Where AI entersUsing the checked commentary from Step 3 and the flagged numbers from Step 4, AI drafts the summary that sits at the top of the Dashboard.
Exact prompt I useTotal build time, once the template exists: roughly 90 minutes to 2 hours for a mid-sized SME client — down from what’s typically closer to a full working day when every tab is rebuilt from scratch each month.

What a Complete AI-Assisted MIS Report Contains
By this stage, your MIS report should be much more than a collection of financial statements. It should give management a concise view of business performance, highlight key risks, and support faster decision-making. A professionally designed monthly MIS pack typically includes the following sections.
| MIS Section | Purpose | How AI Helps |
|---|---|---|
| 📊 Executive Dashboard | Provides management with an at-a-glance view of business performance through key financial KPIs. | Drafts executive summaries and highlights the most important business insights. |
| 💰 Profit & Loss Analysis | Compares current month performance against previous month, budget and prior year. | Generates variance commentary for significant movements after finance verification. |
| 🏦 Balance Sheet Summary | Summarises assets, liabilities and equity to monitor the company’s financial position. | Suggests a clean reporting structure and presentation format. |
| 💵 Cash Flow Summary | Shows operating, investing and financing cash flows to assess liquidity. | Summarises major cash flow movements in plain business language. |
| 📈 KPI & Ratio Dashboard | Tracks Revenue Growth, EBITDA Margin, Gross Margin, Current Ratio, Debtor Days, Inventory Days and DSCR. | Flags unusual trends and identifies KPIs requiring management attention. |
| 📋 Budget vs Actual | Measures operational performance against approved budgets. | Drafts explanations for material budget variances using verified data. |
| ✅ Management Action Points | Summarises key business issues, risks and recommended management actions. | Creates concise executive action summaries from validated financial analysis. |

Where this build goes wrong
Two mistakes come up again and again. Skipping the check in Step 2. An unchecked mapping quietly puts a number in the wrong place — and it stays wrong every month until someone notices the ratios look off. Using the raw output from Step 3 in Step 5, instead of your corrected version. That turns one small unverified guess into a sentence a business owner reads first thing in the morning — hard to undo once it’s out.
Build the Template Once. Let AI Handle the Repeat Work Every Month After.
The real time saving here isn’t any single prompt. It’s building the structure once, properly, so every month after that is fill-in-and-check instead of starting from a blank page. Do that one-time work well, and a full day’s task becomes a 90-minute one — without skipping a single thing that actually needs your judgement.
Building an MIS Report in Excel with AI: Questions I Get Asked
How long does it take to build a monthly MIS report using AI?
Can AI build the entire MIS report without manual review?
What’s the biggest time saving in building an MIS report with AI?
Do I need special software to build an MIS report with AI?
How do I keep client data safe while using AI to build an MIS report?