

Financial Ratio Analysis Excel Template
5-Year Analysis • 28+ Ratios • DuPont • Altman Z-Score • Dashboard
Download the Excel template and analyze profitability, liquidity, leverage and business performance.
The Financial Ratio Analysis Excel Template helps users evaluate a company’s profitability, liquidity, solvency, efficiency and financial performance over a five-year period. It includes 28+ financial ratios, comparative analysis, DuPont analysis, Altman Z-Score and a summary dashboard.
A Complete Financial Ratio Analysis Toolkit
Analyze business financial performance with a structured financial ratio analysis Excel template covering profitability, liquidity, leverage, efficiency, cash flow and credit metrics. Review 5 years of financial data, compare ratios with benchmark ranges and use integrated analysis tools to understand financial performance and trends.
Metrics
28+ Financial Ratios & Metrics
Analyze liquidity, profitability, leverage, efficiency, cash flow and credit-related metrics in one workbook.
5-Year Trend Analysis
Compare financial ratios across five years instead of relying on a single-period snapshot.
Benchmark Comparison
Review ratios alongside reference benchmark ranges to put financial performance into context.
Formula & Plain-English Explanation
Each ratio includes its calculation formula and a simple explanation of what the metric helps you evaluate.
DuPont ROE Analysis
Break down ROE into profit margin, asset turnover and equity multiplier to understand return drivers.
Altman Z”-Score
Use the Altman Z”-Score as an additional financial distress indicator for applicable company types.
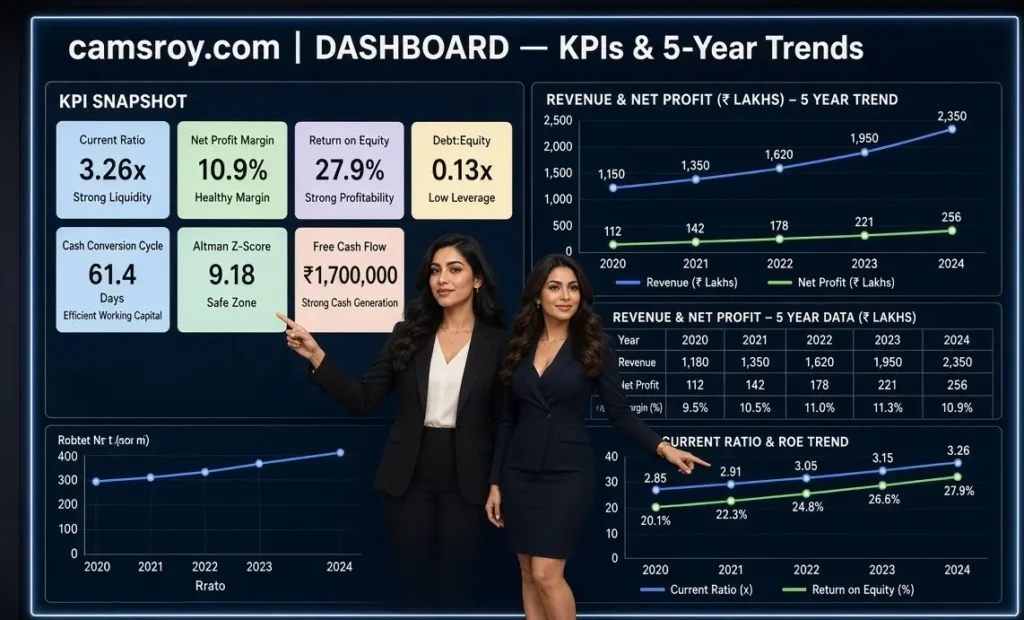
Dashboard & Health Summary
View key financial KPIs, five-year trends and a traffic-light financial health summary in one dashboard.

Don’t assess a financial ratio in isolation. Compare ratios across multiple years and against relevant benchmarks to identify trends and better understand the underlying financial performance of the business.


What Financial Ratios Can You Analyze?
This financial ratio analysis Excel template brings together a comprehensive set of financial ratios and performance metrics used to assess a company’s financial health and operating performance. It covers profitability ratios, liquidity ratios, leverage and solvency ratios, efficiency ratios, cash flow ratios and debt-servicing metrics, making it useful for structured financial statement analysis and business performance review.
Use the template to calculate and compare key financial ratios in Excel, review multi-year trends and understand how changes in revenue, profit, assets, liabilities, working capital and debt affect financial performance. The analysis can support financial reporting, management analysis, credit assessment, business valuation, investment analysis and financial decision-making.
The analysis is organized into the following key financial areas:
Liquidity Ratios
Assess the ability of a business to meet its short-term obligations using Current Ratio, Quick Ratio and Cash Ratio.
Profitability Ratios
Measure how effectively the business generates profit through Gross Profit Margin, EBITDA Margin, Net Profit Margin, ROA, ROE and ROCE.
Leverage & Solvency Ratios
Evaluate debt levels and financial risk using Debt-to-Equity, Debt-to-Assets, Interest Coverage and Total Outside Liabilities to Net Worth.

Efficiency Ratios
Analyze how efficiently the business manages working capital and assets through Inventory Turnover, Inventory Days, Receivables Turnover, Debtor Days, Payables Turnover, Creditor Days, Cash Conversion Cycle and Asset Turnover.
Cash Flow Ratios
Evaluate operating cash generation and cash-based financial strength using Operating Cash Flow Ratio, Cash Flow to Debt and Free Cash Flow.
Credit & Debt Ratios
Assess debt-servicing ability and financial coverage through DSCR, Net Debt/EBITDA, Total Debt/EBITDA, Fixed Asset Coverage and Proprietary Ratio.
What Does Financial Ratio Analysis Tell You??
Financial ratios turn financial statement data into measurable indicators that help assess a company’s financial health, profitability, liquidity, leverage and operating efficiency. Looking at ratios across multiple years can reveal trends that may not be obvious from the financial statements alone.
Use the analysis to answer important financial questions such as:
Is the Business Profitable?
Use profitability ratios such as Gross Profit Margin, EBITDA Margin, Net Profit Margin, ROA, ROE and ROCE to evaluate how effectively the business generates returns.
Can the Business Meet Its Short-Term Obligations?
Liquidity ratios such as Current Ratio, Quick Ratio and Cash Ratio help assess the company’s ability to meet short-term liabilities.
Is the Business Overleveraged?
Debt and leverage ratios such as Debt-to-Equity, Debt-to-Assets and Net Debt/EBITDA help evaluate reliance on debt and overall financial risk.

How Efficiently Is Working Capital Managed?
Efficiency ratios including Inventory Days, Debtor Days, Creditor Days and Cash Conversion Cycle help identify how efficiently working capital is being managed.
Can the Business Service Its Debt?
Interest Coverage, DSCR and cash-flow-based debt ratios provide useful indicators of the company’s ability to meet interest and debt repayment obligations.
How Is Financial Performance Changing?
Comparing financial ratios over five years helps identify improving or declining trends in profitability, liquidity, leverage, efficiency and cash generation.

How to Use the Financial Ratio Analysis Excel Template
This financial ratio analysis Excel template is structured to make multi-year financial analysis easier, more systematic and easier to interpret. Enter your historical financial statement data in the designated input sheets, and the workbook automatically calculates a wide range of financial ratios and performance metrics. The results are organized into clear analysis sections with five-year trends, benchmark comparisons, formulas, plain-English explanations and performance remarks.
The template also includes advanced analysis tools such as DuPont ROE analysis, Altman Z”-Score and a financial dashboard, helping you move beyond individual ratio calculations and develop a broader view of profitability, liquidity, leverage, efficiency, cash flow and financial strength.
Follow these steps to get started:
01 — Enter Financial Data
Enter the required historical figures from your P&L, Balance Sheet and Cash Flow Statement into the relevant input sections.
02 — Check Your Financial Statements
Review the entered figures and use the Balance Sheet check to verify that the financial data is properly balanced.
03 — Review Financial Ratios
View the automatically calculated liquidity, profitability, leverage, efficiency, cash flow and credit ratios, along with formulas and explanations.

04 — Compare Trends & Benchmarks
Compare financial ratios across five years and review benchmark ranges to identify changes in financial performance and financial position.
05 — Analyze Advanced Metrics
Use DuPont ROE analysis and Altman Z”-Score to gain additional insight into return drivers and financial strength.
06 — Review the Dashboard
Use the financial analysis dashboard to quickly review key KPIs, ratio trends and the overall financial health summary.

Why Use This Financial Ratio Analysis Excel Template?
Financial ratio analysis is more useful when individual ratios can be reviewed together, compared over time and interpreted in context. This financial ratio analysis Excel template combines ratio calculations, five-year trend analysis, benchmark references and advanced financial analysis tools in one structured workbook.
Key advantages include:
Compare Financial Performance Over 5 Years
Track changes in profitability, liquidity, leverage, efficiency and other financial metrics across multiple years.
Understand the Drivers of ROE
Use DuPont analysis to break down Return on Equity into profit margin, asset turnover and equity multiplier.
Review Ratios Against Benchmarks
Compare calculated ratios with reference benchmark ranges to provide additional context when evaluating financial performance.

Go Beyond Basic Ratio Analysis
Use DSCR, Debt/EBITDA, Interest Coverage, Fixed Asset Coverage and Altman Z”-Score for deeper leverage, credit and financial-strength analysis.
Get a Quick Financial Overview
Use the dashboard to review key KPIs, five-year trends and the overall financial health summary without going through every ratio individually.
Keep the Analysis in One Excel Workbook
Bring financial statement inputs, ratio calculations, explanations, benchmarks and advanced analysis together in a practical financial analysis Excel template.


Download the Financial Ratio Analysis Excel Template
Get the free Excel template to analyze 28+ financial ratios and metrics across five years. Review profitability, liquidity, leverage, efficiency, cash flow and credit metrics with benchmarks, trend analysis, DuPont ROE analysis, Altman Z”-Score and a financial dashboard.
↓ Download Free Excel TemplateFrequently Asked Questions

Explore More Excel Templates & Financial Models
Explore our collection of free Excel templates, financial models and financial analysis tools designed for practical finance and business needs. Find ready-to-use resources for financial ratio analysis, financial statements, project finance, budgeting, forecasting, cash flow management, loan analysis, investment evaluation and business planning—all created to simplify financial analysis and support better financial decision-making.
SME Financial Excel Templates & Utilities
- ROI Excel Template (Free Download) – Financial Model
- SME Financial Dashboard Excel Template (Free KPI Tracker)
- Free Financial Model Excel Template -Track Your Business KPI
- 13 Week Cash Flow Forecast Excel Template – Track Cash Weekly
- Free Startup MIS Dashboard Excel Template with KPI Dashboard
- Budget vs Actual Excel Template (Free Download) for SMEs
- Accounts Receivable and Payable Tracker Excel Template – Free
- Payroll Salary Register Excel Template (Free Download)
- Bid Evaluation Financial Model Excel Template (Free Download)
- BESS Financial Model Excel Template – Free Project Finance Model
- Free DSCR Debt Sculpting Excel Template | Project Finance Model
- Inventory Management Excel Template – Free Download
- Break Even Analysis Excel Template – Free Excel Download
- Monthly Financial Statement Excel Template with Ratios

Stay Updated with New Financial Excel Templates & Tools
Disclaimer
This Financial Ratio Analysis Excel Template is provided for educational, analytical and planning purposes only. The template uses user-entered financial information and standard financial ratio analysis principles to calculate and present various financial metrics. Actual financial performance and ratio results may vary due to differences in accounting policies, industry characteristics, business conditions, financial data and market factors. Benchmark ranges and financial indicators are provided for general reference and should not be considered definitive standards. Users should verify the underlying data, formulas and assumptions before relying on the results for financial, business, credit or investment decisions.