

Break Even Analysis Excel Template – Free Download
Calculate Break-Even, Contribution Margin, P/V Ratio, Margin of Safety, Target Profit, DOL and Price-Volume-Cost Sensitivity in Excel
What Is Break-Even Analysis?
Break-even analysis is a Cost-Volume-Profit (CVP) technique used to determine the sales volume or revenue required for a business to cover its total costs. At the break-even point, total revenue equals total cost and operating profit is zero.
What Is the Break-Even Point?
The break-even point is the level of sales at which a business recovers its fixed and variable costs. Sales above this point can generate operating profit, assuming the underlying price and cost assumptions remain unchanged.
How Is Break-Even Analysis Used for Planning?
Break-even analysis helps businesses plan pricing, sales volume and profitability. Management can first determine the break-even level and then set a higher sales target to achieve the desired profit.
Why Break-Even Analysis Matters
It provides a practical view of how changes in selling price, sales volume, variable costs and fixed costs can affect profitability.
- Set realistic sales targets
- Evaluate pricing decisions
- Understand cost structure
- Plan target profit
Break-Even Analysis for SMEs
For SMEs, break-even analysis can help answer a simple question: How much does the business need to sell before it becomes profitable?
For businesses with multiple products, the answer also depends on the product mix and contribution margin of each product.
Where Revenue Covers Total Cost
The break-even point occurs where the revenue line intersects the total-cost line. To the left of this point, the business operates at a loss; to the right, it generates operating profit.
What Does This Break Even Analysis Excel Template Calculate?
Once the basic concept of break-even analysis is clear, the next step is to understand what the Excel template actually calculates. The model brings together product-level pricing, variable costs, expected sales volume and fixed-cost assumptions to provide a practical view of break-even, contribution, profitability and operating risk.

Break-Even Units
Calculates the number of units required to cover total costs and reach the break-even point. For multiple products, the calculation considers the current product mix and blended contribution margin.
Break-Even Revenue
Shows the sales revenue required to break even, making it easier to set revenue-based sales targets.
Contribution Margin
Calculates contribution per unit, total contribution and contribution margin percentage, showing how much sales contribute toward fixed costs and profit.
Margin of Safety
Shows how far expected sales are above the break-even level, helping measure the sales buffer before an operating loss.

Target Profit
Calculates the sales volume required to achieve a specified profit target, including an after-tax target using the assumed effective tax rate.
Cash Break-Even
Calculates break-even after removing depreciation from fixed costs, providing a view of the sales level required to cover the cash cost burden.
Operating Leverage
Calculates Degree of Operating Leverage (DOL) to show how changes in sales can affect operating profit, particularly when the business has significant fixed costs.

How the Break Even Analysis Excel Template Works
The template follows a simple flow from business assumptions and product inputs to contribution, break-even, profitability and sensitivity analysis. Once the basic inputs are entered, the workbook automatically calculates the key metrics and presents them through the analysis sheets and dashboard. The following steps explain how each part of the model works and how the inputs flow into the final analysis.
Business Assumptions
Start by entering the general assumptions used throughout the model, including working days, depreciation, effective tax rate, target profit and sensitivity bands.
Product Inputs
Enter the details for each product, including selling price, variable cost, expected sales volume, GST rate and allocated fixed cost. The template supports up to eight products.
Contribution Margin
The model uses selling price and variable cost to calculate contribution margin per unit, contribution margin percentage and total contribution for each product.

Company Break-Even
The product-level contribution and sales mix are combined to calculate the blended contribution margin, company-wide break-even units, break-even revenue and margin of safety.
Product-Level Break-Even
The template also provides an indicative break-even calculation for each product using its allocated share of fixed costs. This helps compare the relative contribution and break-even requirements of different products.
Sensitivity Analysis
The model tests how the break-even point changes when selling price, variable cost or fixed cost changes. Results are presented through a sensitivity table and tornado analysis to highlight the most significant drivers.

Key Concepts of Break-Even Analysis
Before working with break-even analysis formulas, it is important to understand the key components of Cost-Volume-Profit (CVP) analysis. Selling price, fixed cost, variable cost, contribution margin, sales volume and profit are closely connected, and changes in any of these factors can affect the break-even point and overall profitability. The following concepts form the foundation of this Break Even Analysis Excel Template.
Selling Price
The amount charged to the customer for each unit. Selling price directly affects revenue and contribution margin in break-even analysis.
Fixed Cost
Costs that generally remain unchanged as sales volume changes within a relevant operating range, such as rent, salaries and depreciation.
Variable Cost
Costs that change with production or sales volume, such as raw materials, packaging and sales commissions.
Sales Volume
The number of units sold or expected to be sold during a period. Changes in volume directly affect total contribution and operating profit.
Contribution Margin
The amount remaining after variable costs are deducted from sales. Contribution first covers fixed costs and then generates operating profit.
Contribution Margin Ratio
Contribution margin expressed as a percentage of sales. It shows how much of each rupee of revenue is available to cover fixed costs and profit.
P/V Ratio
The Profit-Volume Ratio measures contribution as a percentage of sales. In basic CVP analysis, it is effectively the same as the CM ratio.
Operating Profit
Profit remaining after operating fixed costs are deducted from total contribution. It is commonly measured as EBIT.
Product Mix
The proportion of different products in total sales. Product mix affects blended contribution margin and the overall break-even point.
Target Profit
The profit a business aims to achieve above break-even. CVP analysis can determine the sales volume required to reach this target.
Margin of Safety
The amount by which expected or actual sales exceed break-even sales. It represents the sales buffer before an operating loss occurs.
Operating Leverage
Shows how the fixed-cost structure affects the sensitivity of operating profit to changes in sales.
Degree of Operating Leverage
DOL quantifies the sensitivity of operating profit to changes in sales by comparing contribution with operating profit.



Break-Even Analysis Formulas
Break-even analysis formulas provide the mathematical foundation for calculating the break-even point, break-even units, break-even sales, contribution margin, margin of safety and target profit. These formulas show how selling price, variable costs and fixed costs interact to determine the sales level required for a business to cover its costs and generate profit. The following formulas are also used in this Break Even Analysis Excel Template to calculate and analyse the key profitability metrics.
Contribution Margin Formula
Shows how much each unit contributes toward fixed costs and profit.
Contribution Margin Ratio
Shows contribution as a percentage of selling price.
Break-Even Units Formula
Calculates the units required to recover total fixed costs.
Break-Even Sales Formula
Calculates the revenue required to reach the break-even point.
Margin of Safety Formula
Shows how much sales can fall before the business reaches break-even.
Target Profit Formula
Calculates the units required to cover costs and achieve target profit.
Degree of Operating Leverage
Measures how sensitive operating profit is to changes in sales.



Multi-Product Break-Even Analysis
A single-product break-even calculation is relatively straightforward, but businesses selling multiple products face an additional challenge: each product can have a different selling price, variable cost and contribution margin. Therefore, the overall break-even point depends on the sales mix and blended contribution margin of the products.
This Break Even Analysis Excel Template is designed to handle multiple products and translate their individual economics into a company-wide break-even view. The following concepts explain how product mix, blended contribution margin and product-level break-even work together in the model.
Product Mix
Product mix represents the proportion of each product in the company’s total sales volume. A change in the mix can change the overall contribution margin and, consequently, the company’s break-even point.
Blended Contribution Margin
For multiple products, the template calculates a blended contribution margin based on the current product mix. This provides a single contribution measure that can be used to determine the company’s overall break-even level.
Product-Level Break-Even
The template also calculates an indicative break-even level for individual products using their allocated fixed costs and contribution per unit. This helps compare products, while the company-wide break-even remains the primary measure for overall business planning.


Price, Volume and Cost Sensitivity Analysis
Break-even analysis shows the sales level required under a given set of assumptions, but business conditions rarely remain constant. Price, volume and cost sensitivity analysis helps management understand how changes in selling price, sales volume, variable costs and fixed costs can affect the break-even point and profitability. The Excel template uses these scenarios to test the resilience of the business under different operating conditions.
Price Sensitivity
A change in selling price directly affects the contribution margin per unit. A higher price generally lowers the break-even volume, while a lower price increases the number of units required to cover fixed costs.
Volume Sensitivity
Changes in sales volume affect total contribution and operating profit. Comparing different volume levels helps determine whether expected sales are sufficient to move the business comfortably beyond break-even.
Variable Cost Sensitivity
An increase in variable cost reduces contribution per unit and generally increases the break-even volume. The analysis helps assess the impact of changes in raw material, packaging, commission or other unit-level costs.

Fixed Cost Sensitivity
Higher fixed costs increase the contribution required to reach break-even. The sensitivity analysis shows how changes in rent, salaries, depreciation or other fixed operating costs can affect the required sales level.
Sensitivity Table
The template brings different price, variable-cost and fixed-cost scenarios together in a break-even sensitivity table. This allows management to compare the impact of individual changes against the base case.
Tornado Chart
The tornado chart ranks the major sensitivity drivers by their impact on break-even volume. It provides a quick visual indication of which assumptions have the greatest influence on the business’s break-even position.

Operating Leverage and Break-Even Analysis
Break-even analysis focuses on the sales level required to cover costs, while operating leverage helps explain how the cost structure affects profit when sales change. A business with a higher proportion of fixed costs can experience a larger change in operating profit from the same percentage change in sales.
The following concepts connect fixed costs, contribution margin, operating profit and Degree of Operating Leverage (DOL) to the break-even analysis.
What Is Operating Leverage?
Operating leverage refers to the effect of fixed operating costs on a business’s profitability. When fixed costs are high, a larger portion of each additional rupee of contribution can flow into operating profit once fixed costs have been covered.
What Is Degree of Operating Leverage (DOL)?
Degree of Operating Leverage (DOL) measures how sensitive operating profit is to a change in sales. It is commonly calculated as:
DOL = Contribution Margin ÷ Operating Profit (EBIT)
A higher DOL generally indicates that operating profit can change more significantly when sales increase or decrease.

How Fixed Costs Affect Operating Leverage
Businesses with higher fixed costs generally have greater operating leverage. This can improve profit growth when sales increase, but it can also increase operating risk when sales decline because fixed costs continue to be incurred.
Using DOL for Profitability Analysis
The DOL calculated in the Excel template helps management understand the operating risk and profit sensitivity of the current business structure. It can be considered alongside break-even point and margin of safety to assess how comfortably the business can absorb changes in sales.

Accounting Break-Even vs Cash Break-Even
Break-even analysis can be viewed from both an accounting profitability perspective and a cash-cost perspective. The difference mainly arises from non-cash expenses such as depreciation. Understanding both measures helps management assess when the business covers its accounting costs and when it covers its underlying cash operating cost burden.
What Is Accounting Break-Even?
Accounting break-even is the sales level at which total contribution is sufficient to cover the business’s operating fixed costs, including non-cash expenses such as depreciation. At this point, operating profit (EBIT) is zero.
What Is Cash Break-Even?
Cash break-even adjusts the fixed-cost burden by excluding depreciation and other non-cash costs. It therefore indicates the approximate sales level required to cover the business’s cash operating cost burden.

Role of Depreciation
Depreciation reduces accounting profit but does not represent a current-period cash outflow. Therefore, removing depreciation from fixed costs can result in a lower cash break-even point than accounting break-even.
Accounting vs Cash Break-Even in the Excel Template
The template presents both measures so users can compare the sales level required to cover accounting fixed costs with the level required to cover cash fixed costs. This provides a more complete view of the business’s profitability and operating cost structure.

Target Profit Analysis
Break-even analysis tells you the sales level at which profit becomes zero. Target profit analysis takes the next step by determining how much the business needs to sell to achieve a specific profit target after covering its fixed and variable costs.
The following concepts explain how target profit extends the basic break-even calculation.
What Is Target Profit Analysis?
Target profit analysis determines the sales volume or revenue required to achieve a desired operating profit. It uses contribution margin to identify the additional contribution needed above the break-even level.
Break-Even vs Target Profit
At break-even, the business earns zero operating profit. Under target profit analysis, the business must generate enough additional contribution to cover fixed costs and achieve the specified profit target.
Break-Even: Fixed Costs ÷ Contribution per Unit
Target Profit: (Fixed Costs + Target Profit) ÷ Contribution per Unit

Sales Volume Required for Target Profit
The required sales volume depends on the business’s fixed costs, contribution margin per unit and target profit. A higher contribution margin reduces the number of units required to achieve the same profit target.
After-Tax Target Profit
The Excel template also supports an after-tax target profit. The specified after-tax target is grossed up using the assumed effective tax rate to estimate the pre-tax profit required for the target to be achieved.
This provides a practical way to connect profit targets with required sales volume in the break-even and profitability model.

Margin of Safety Analysis
The margin of safety is an important Cost-Volume-Profit (CVP) measure that shows how much sales can decline before a business reaches its break-even point. It helps management assess the buffer between expected sales and break-even sales and understand the level of operating risk.
The following measures show how the margin of safety can be evaluated in units, revenue and percentage terms.
What Is Margin of Safety?
Margin of safety represents the amount by which actual or expected sales exceed break-even sales. A higher margin of safety generally indicates a greater buffer before the business moves into an operating loss.
Margin of Safety in Units
Margin of safety in units measures the difference between expected sales volume and break-even units.
Margin of Safety Units = Expected Units − Break-Even Units
Margin of Safety in Revenue
Margin of safety can also be measured in monetary terms by comparing expected sales revenue with break-even revenue.
Margin of Safety Revenue = Expected Sales Revenue − Break-Even Revenue

Margin of Safety Percentage
The margin of safety percentage expresses the sales buffer relative to expected sales.
Margin of Safety % = Margin of Safety Revenue ÷ Expected Sales Revenue × 100
A higher percentage generally indicates that the business has more room to absorb a decline in sales before reaching break-even.
How to Interpret Margin of Safety
A high margin of safety generally indicates a stronger buffer against lower sales, while a low margin of safety indicates that a relatively small decline in sales could bring the business close to break-even. It should be considered together with contribution margin, fixed costs and operating leverage when assessing business risk.

Break-Even Chart in Excel
A break-even chart in Excel provides a visual way to understand the relationship between sales volume, revenue and total costs. It helps identify the break-even point, where total revenue equals total cost, and makes it easier to see the transition from an operating loss to an operating profit.
The following elements explain how a break-even graph can support business and profitability analysis.
How the Break-Even Chart Works
A typical break-even analysis chart plots revenue and total costs at different sales volumes. The point where the revenue line intersects the total-cost line represents the break-even point.
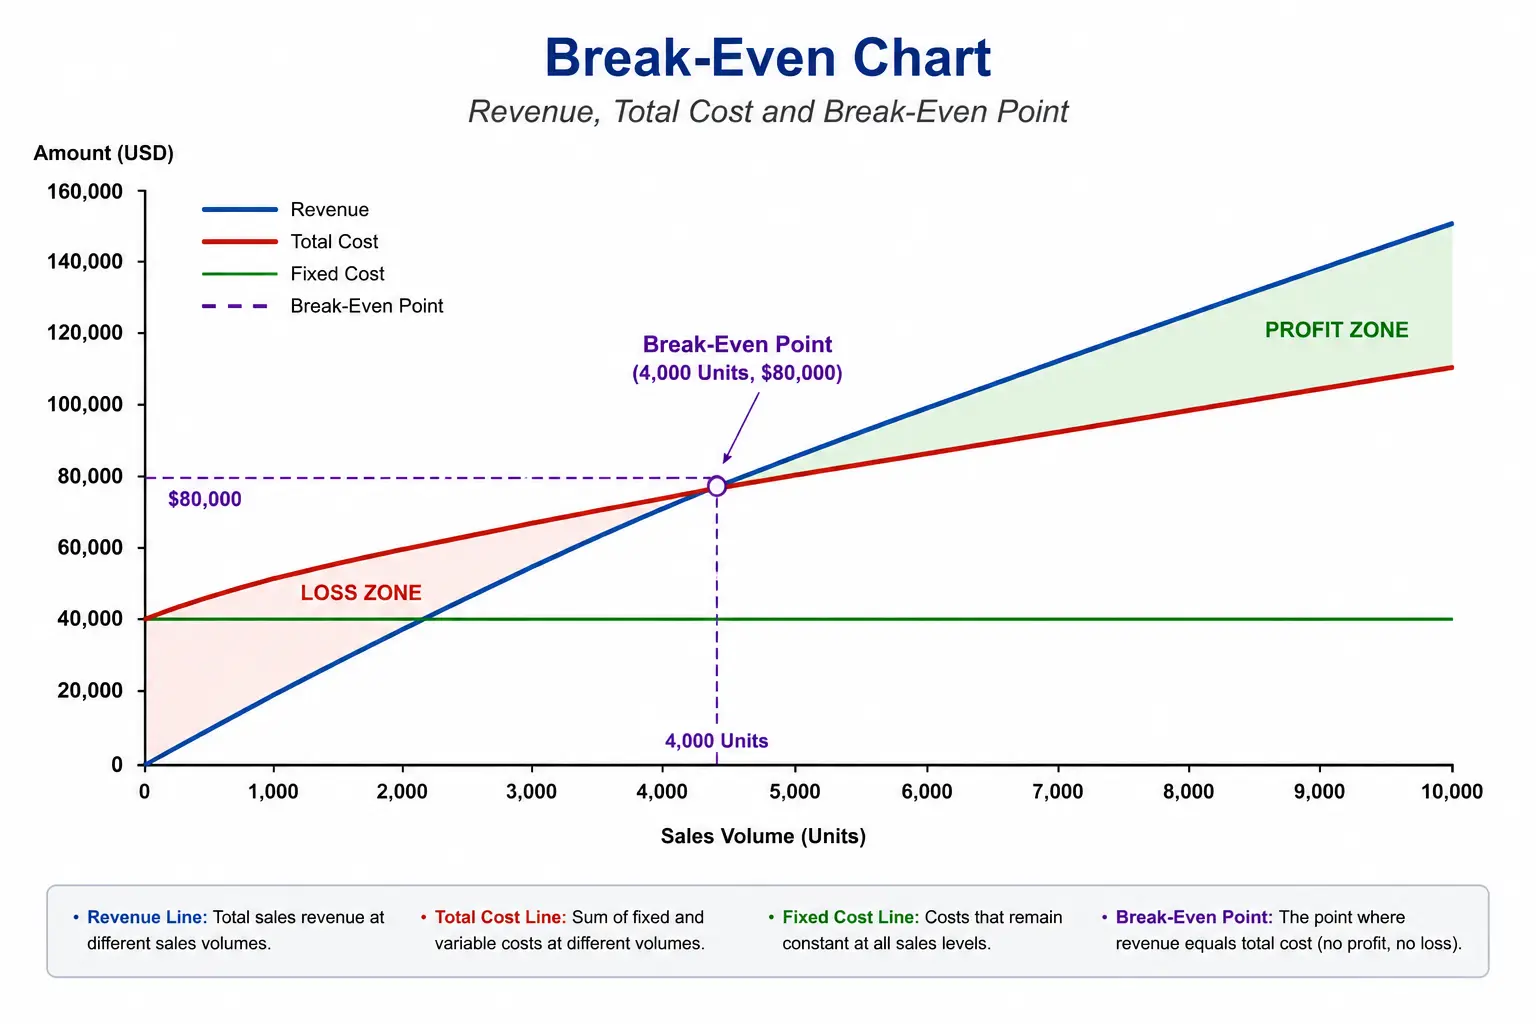
Profit and Loss Zones
Sales below the break-even point generally indicate an operating loss because revenue is insufficient to cover total costs. Sales above the break-even point indicate an operating profit, assuming the selling price, variable cost and other model assumptions remain consistent.
Using a Break-Even Chart for Decision-Making
A break-even graph in Excel makes it easier to assess required sales volume, cost structure and profitability at a glance. In this Excel template, the break-even chart is linked to the underlying model calculations, allowing the analysis to change when the business assumptions change.

Example of Break-Even Analysis
The following break-even analysis example shows how selling price, variable cost, fixed cost and sales volume work together to calculate contribution margin, break-even point, margin of safety and target profit.
Example Business Inputs
Assume the following monthly operating assumptions.
Contribution Margin
Contribution Margin Ratio: 40%
Break-Even Point
Break-Even Revenue: ₹10,00,000
Margin of Safety
Margin of Safety: 50%
What if the business wants ₹2,00,000 profit?
The required sales volume is calculated by adding the target profit to fixed costs and dividing the result by contribution per unit.
What happens if variable cost increases?
If variable cost rises from ₹600 to ₹650, contribution falls from ₹400 to ₹350 per unit.

Key Assumptions and Limitations
A break-even analysis Excel template is only as reliable as the assumptions used in the model. The results depend on factors such as selling price, variable cost, fixed cost, sales volume and product mix.
Understanding these assumptions helps users interpret the break-even point, profitability and sensitivity analysis correctly.
Fixed and Variable Cost Assumptions
The model classifies costs as fixed or variable. Fixed costs are assumed to remain stable, while variable costs change with sales volume within the relevant operating range.
Selling Price and Sales Volume Assumptions
The analysis assumes that selling price and variable cost per unit remain reasonably consistent over the relevant sales range. Changes in pricing, discounts or volume can affect the break-even result.
Product Mix Assumptions
For multiple products, break-even depends on the sales mix and contribution margin of each product. A significant change in product mix can therefore change the blended contribution margin and overall break-even point.

GST Treatment
The model uses GST-exclusive selling price and variable cost for break-even calculations where GST is recoverable. The GST rate is included primarily as a reference input.
Depreciation and Cash Break-Even
Depreciation is a non-cash accounting expense, so the template distinguishes accounting break-even from cash break-even by adjusting for depreciation where applicable.
Limitations of Break-Even Analysis
Break-even analysis is a planning tool rather than a complete financial forecast. It does not fully capture factors such as working capital, financing costs, capacity constraints, changing product mix or unexpected market conditions.

Download the Break Even Analysis Excel Template
Download the free Break Even Analysis Excel Template to analyse contribution margin, break-even units, break-even revenue, margin of safety, target profit, cash break-even and operating leverage.

How to Use the Break Even Analysis Excel Template
Once downloaded, the Break Even Analysis Excel Template can be customised with your own business data to perform a practical break-even and profitability analysis in Excel. Enter your pricing, cost and sales assumptions to calculate contribution margin, break-even units, break-even revenue, margin of safety, target profit and cash break-even. The template also allows you to test price, volume and cost sensitivity and assess operating leverage, making it useful for business planning, budgeting and profitability decisions.
The following six steps explain how to use the workbook from initial inputs through final analysis.
1. Enter Business Assumptions
Enter key assumptions such as working days, depreciation, effective tax rate, target profit and sensitivity ranges used in the model.
2. Enter Product Details
Add the product name, selling price, variable cost, expected sales volume, GST rate and allocated fixed cost for each product.
3. Review Contribution Margin
The model automatically calculates contribution per unit, contribution margin percentage and total contribution based on your product inputs.

4. Analyse Break-Even Results
Review the calculated blended contribution margin, break-even units, break-even revenue and margin of safety to understand the sales level required to cover costs.
5. Test Business Scenarios
Use the sensitivity analysis to assess how changes in selling price, sales volume, variable cost and fixed cost affect the break-even position.
6. Review the Dashboard
Use the dashboard to bring the analysis together and review break-even, target profit, cash break-even, operating leverage and sensitivity results for management decision-making.
Frequently Asked Questions About Break-Even Analysis

Explore More Excel Templates & Financial Models
Explore our growing collection of free Excel templates, financial models and business tools designed to simplify financial planning, analysis and decision-making. Discover ready-to-use solutions for project finance, budgeting, financial forecasting, investment analysis, loan calculations, cash flow planning and financial reporting—helping professionals, businesses and students save time, improve analysis and make better-informed financial decisions.
SME Financial Excel Templates & Utilities
- ROI Excel Template (Free Download) – Financial Model
- SME Financial Dashboard Excel Template (Free KPI Tracker)
- Free Financial Model Excel Template -Track Your Business KPI
- 13 Week Cash Flow Forecast Excel Template – Track Cash Weekly
- Free Startup MIS Dashboard Excel Template with KPI Dashboard
- Budget vs Actual Excel Template (Free Download) for SMEs
- Accounts Receivable and Payable Tracker Excel Template – Free
- Payroll Salary Register Excel Template (Free Download)
- Bid Evaluation Financial Model Excel Template (Free Download)
- BESS Financial Model Excel Template – Free Project Finance Model
- Free DSCR Debt Sculpting Excel Template | Project Finance Model
- Inventory Management Excel Template – Free Download

Stay Updated on New Excel Templates
Get free Excel templates, financial models and practical finance tools delivered to your inbox. No spam—just useful resources and new releases.
Disclaimer
This Break Even Analysis Excel Template is provided for educational and planning purposes only. The calculations are based on user-entered assumptions and standard break-even and Cost-Volume-Profit (CVP) principles. Actual business results may differ due to changes in pricing, costs, sales volume, product mix, taxes, market conditions and other factors. Users should validate the assumptions and calculations before making financial or business decisions.