

Budget vs Actual Excel Template (Free Download)
Download a free Budget vs Actual Excel Template to compare budgeted and actual revenue, expenses, and profit with automatic variance analysis. Built for Indian SMEs, startups, and finance professionals. No signup required.
✓ Free Download • ✓ No Signup Required • ✓ Microsoft Excel (.xlsx)What is a Budget vs Actual Excel Template — and Why Your Business Needs One
A Budget vs Actual Excel Template is a structured spreadsheet that lets you compare your planned financial figures — revenue targets, expense budgets, and profit goals — against what actually happened. It automatically calculates variance analysis (the gap between plan and reality) so you can spot overruns early, protect margins, and make faster decisions every month. Free download — no signup required.
For Indian SMEs, startups, and freelancers, tracking budget vs actuals is the single most important financial habit you can build. Without it, overspending goes unnoticed until the bank balance tells you — by which time it is often too late to course-correct.
This Budget vs Actual Excel Template free download from camsroy.com is built specifically for the Indian business context — April–March financial year, ₹ currency, and line items relevant to services, trading, and manufacturing businesses alike.
Who This Template Is For
- Small business owners tracking monthly performance against plan
- Startup founders monitoring burn and revenue against projections
- Freelancers and consultants comparing project income vs targets
- Chartered Accountants preparing client MIS reports
- Finance managers presenting variance reports to leadership
- Anyone who budgets in Excel and needs to track actual results
Key Features at a Glance

What’s Included in This Budget vs Actual Excel Template
Six purpose-built sheets, all auto-linked. Enter your numbers once in the Data Input sheet and every other sheet updates automatically — P&L, Dashboard, OPEX Tracker and more.
Monthly Budget vs Actual Tracker
The master data entry sheet. Enter your Budget and Actual figures for all 12 months across revenue lines and expense categories. All other sheets pull from here automatically. Colour-coded input cells make data entry foolproof.
Budget vs Actual Variance Analysis
Full-year P&L summary with Budget, Actual, Variance (₹), and Variance % for every line — Revenue, COGS, Gross Profit, each OpEx category, EBITDA, and Net Profit. Includes automatic favourable / unfavourable status flags.
Profit & Loss Summary
A structured Income Statement showing Revenue → Gross Profit → Operating Expenses → EBITDA → Net Profit. Pulls from the tracker and calculates Gross Margin % and EBITDA Margin % automatically against budget and actuals.
OPEX Budget vs Actual Tracker
Dedicated operating expense drill-down across 10 categories including Salaries, Rent, Marketing, Technology, Travel, and more. Shows each category’s budget, actual, variance, and its share of total spending at a glance.
Executive Dashboard
KPI Scorecard with 8 key metrics (Revenue, Total Expenses, EBITDA, Gross Profit, Gross Margin %, EBITDA Margin %, Payroll, and Marketing spend) plus a full month-by-month revenue and expense comparison table with variance rows.
Instructions Sheet
Step-by-step guide explaining exactly what to enter, where, and in what format. Includes formula notes, customisation tips, and a colour legend. Ideal for team members or clients using the template for the first time.
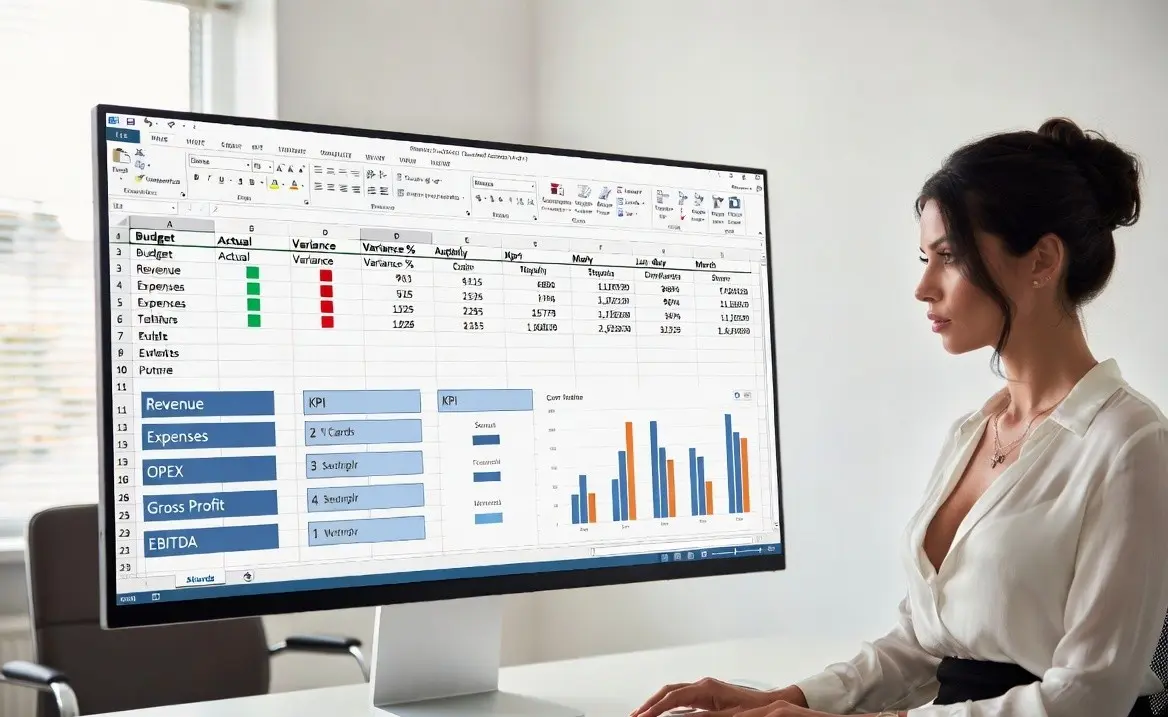
Template Preview — P&L Budget vs Actual Sheet
| A | B | C | D | E | F |
|---|---|---|---|---|---|
| Line Item | Budget (₹) | Actual (₹) | Variance (₹) | Variance % | Status |
| 📦 REVENUE | |||||
| Product / Service Line 1 | 6,370 | 6,509 | +139 | 2.2% | ✅ On Track |
| Product / Service Line 2 | 2,830 | 2,917 | +87 | 3.1% | ✅ On Track |
| Other Revenue | 767 | 777 | +10 | 1.3% | ✅ On Track |
| TOTAL REVENUE | 11,502 | 11,773 | +271 | 2.4% | ✅ On Track |
| 💸 OPERATING EXPENSES | |||||
| Salaries & Wages | 3,680 | 3,750 | +70 | 1.9% | ⚠ Over Budget |
| Marketing & Advertising | 845 | 915 | +70 | 8.3% | ⚠ Over Budget |
| TOTAL OPEX | 7,076 | 7,247 | +171 | 2.4% | ⚠ Over Budget |
| EBITDA | 1,931 | 1,929 | −2 | −0.1% | ⚠ Monitor |
Budget vs Actuals Variance Analysis — How It Works
The Budget vs Actuals Variance Analysis Excel sheet in this template does the heavy lifting for you — automatically comparing what you planned to spend or earn against what actually happened, and flagging every gap with ₹ amount, percentage, and status. Understanding variance is the foundation of financial control in every well-run business.
What is Variance Analysis?
Variance analysis compares budgeted financial figures against actual results for a given period — monthly, quarterly, or annually. The comparison reveals where performance is ahead of plan (favourable variance) and where it is falling short (unfavourable variance).
In the context of a small business, variance analysis answers three critical questions: Where did we overspend? Where did revenue fall short? And what does that mean for our profitability this month?
How Variance is Calculated
Variance (₹) = Actual − Budget
Variance (%) = (Actual − Budget) ÷ |Budget| × 100
Note: For revenue, a positive variance is favourable (earned more than planned). For expenses, a positive variance is unfavourable (spent more than budgeted).
Types of Variance — At a Glance
Favourable Variance
Revenue higher than budget, or expenses lower than budget. A positive outcome.
Unfavourable Variance
Revenue below budget, or expenses above budget. Requires investigation.
Variance % — Why It Matters More Than the ₹ Amount
A ₹10,000 overspend on a ₹1,00,000 budget is 10% — serious. The same ₹10,000 on a ₹10,00,000 budget is just 1% — probably fine. Always read the percentage alongside the rupee amount.
Worked Example — Reading a Variance Report
| Line Item | Budget (₹) | Actual (₹) | Variance (₹) | Variance % | Type | Status |
|---|---|---|---|---|---|---|
| Total Revenue | 11,50,000 | 11,77,300 | +27,300 | +2.4% | Revenue | ✅ Favourable |
| Salaries & Wages | 3,68,000 | 3,75,000 | +7,000 | +1.9% | Expense | ⚠ Unfavourable |
| Marketing & Advertising | 84,500 | 91,500 | +7,000 | +8.3% | Expense | ⚠ Unfavourable |
| Rent & Utilities | 54,000 | 54,500 | +500 | +0.9% | Expense | ✅ Within Tolerance |
| EBITDA | 1,93,100 | 1,92,900 | −200 | −0.1% | Profit | ✅ Marginal |
📌 Interpretation: Revenue beat budget by ₹27,300 but marketing overspend of ₹7,000 (8.3% over) warrants investigation. EBITDA is only marginally down — well within an acceptable range.
Monthly Business Budget vs Actuals Excel
The Monthly Business Budget vs Actuals Excel tracker is the core of this template — covering April through March, the full Indian financial year. Enter your budget and actual figures once in the Data Input sheet and every analysis view updates automatically.
Monthly Revenue Tracking
Track up to 4 revenue streams separately — Product Line 1, Line 2, Line 3, and Other Revenue — month by month against your budget targets. The template calculates total revenue, Month-on-Month growth, and Year-to-Date performance automatically.
- Multiple revenue stream support
- Budget vs Actual per month and per stream
- FY Annual total auto-calculated
- Revenue variance ₹ and % per month
Monthly Expense Tracking
Track 10 expense categories — from COGS and Salaries to Marketing, Technology, Travel, and Professional Fees — comparing your actual spend against the budget every month. Instantly see which cost heads are running hot.
- 10 expense categories pre-configured
- COGS tracked separately for Gross Profit
- Monthly overspend flagged automatically
- Annual expense total vs budget
Profit Monitoring
Beyond revenue and expenses, the template tracks Gross Profit, Gross Margin %, EBITDA, EBITDA Margin %, and Net Profit every month — so you always know whether profitability is trending in the right direction.
- Gross Profit and Gross Margin %
- EBITDA and EBITDA Margin %
- Net Profit vs budget
- All margins auto-calculated
Year-End Performance Summary
At the end of FY, the template generates a full-year Budget vs Actual summary across all P&L lines — your complete financial performance record in one place, ready for CA review, board reporting, or investor presentations.
- FY Annual Budget vs Actual totals
- Full-year variance ₹ and % per line
- Profitability summary with margins
- Ready for CA / audit purposes

OPEX Budget vs Actual Excel Template
The OPEX Budget vs Actual Excel Template sheet inside this workbook gives you a granular category-level view of every operating expense — so you know not just that you overspent, but exactly which cost centre is responsible and by how much.
Operating Expense Tracking
The OPEX sheet breaks down all 10 expense categories side-by-side: Budget, Actual, Variance in ₹, Variance as %, percentage of total spend, and an on-track / over-budget status flag.
It also tells you what share of your total operating costs each category represents — so you can see at a glance whether Salaries are consuming 60% of OpEx when they should be at 50%, for example.
Cost Control and Monitoring
- Spot which categories are consistently over budget
- See the weight of each cost head as % of total OpEx
- Identify discretionary vs fixed expense overruns
- Take action before the overrun compounds month after month
- Share with department heads for accountability
OPEX Variance Snapshot — Illustrative
Bar = Actual as % of Budget. Over 100% = over budget.
Budget vs Actual Excel Template for Indian Businesses
Most free Excel templates online are built for a US or UK financial calendar. This one is different — structured around the way Indian businesses actually operate.
Designed Around the Indian Financial Year
The template runs April to March — matching the Indian financial year exactly. No need to rearrange months or fight with January–December calendar layouts. The FY Annual total aggregates across all 12 months from April through March.
- April–March FY structure built-in
- ₹ (Indian Rupee) currency throughout
- Line items relevant to Indian SMEs and service businesses
- Compatible with Tally-exported data formats
- Useful for Pvt Ltd, LLP, Proprietorship and Partnership firms
Who Uses This Template in India
How to Use This Budget vs Actual Excel Template
The template is designed for non-technical users. No Excel expertise required. Follow these five steps and your full Budget vs Actual report will be ready in under 30 minutes.
Enter Budget Figures
Open the 📥 Data Input sheet. In Section A (Revenue Budget), enter your planned monthly revenue for each stream across April–March. In Section B (Expense Budget), enter your planned monthly spend for each cost category.
💡 Tip: Ice-blue cells are input cells. All other cells are auto-calculated — do not edit them.
Record Actual Values
At month-end, enter your actual revenue and actual expenses in the corresponding Actual rows below each budget section. These are the real numbers from your books — your Tally, QuickBooks, or bank statements.
💡 Tip: Update actuals within the first week after each month closes for timely reporting.
Review Variance Automatically
Switch to the 💰 P&L BvA sheet. All variances — ₹ amount, percentage, and ✅ / ⚠ status — are calculated automatically. No formulas to write. Green = on track. Orange = over budget.
Analyse the Dashboard
Open the 📊 Dashboard sheet for an executive-level view — 8 KPI metrics, month-by-month revenue tracking, and expense comparison tables. This is the sheet to share with your leadership team, board, or CA.
Monitor Monthly Performance
Repeat steps 2–4 every month. By month 3, patterns will emerge — which cost centres consistently overshoot, which revenue streams underperform, and where your profitability assumptions need revisiting for the next year’s budget.
💡 Tip: Use the OPEX Tracker sheet to drill into individual expense categories before your monthly review meeting.
⚡ Quick-Start Checklist

Download the Free Budget vs Actual Excel Template
Budget vs Actual Excel Template — Free Download
Built for Indian SMEs, startups, and CAs. Covers the full April–March financial year with 6 linked sheets, 380+ formulas, and sample data pre-loaded.
Frequently Asked Questions
Variance (₹) = Actual − Budget
Variance (%) = (Actual − Budget) ÷ ABS(Budget) × 100
In this template, all variance calculations are pre-built — you just enter your Budget and Actual figures and the template does everything else automatically.
Related Excel Templates
Download more free finance Excel templates from camsroy.com — built for Indian SMEs, startups, and finance professionals.
Stay Updated with New Free Excel Templates
Get free Excel templates, financial models, dashboards, and business tools delivered to your inbox.
✔ Free Resources • ✔ No Spam • ✔ Unsubscribe Anytime